Incorporating Awareness of Authoring by Humans and Technologies in Data Collection and Visualizations
Background and Methods
In endeavoring to assemble a large-scale data collection of Twitter data related to the keyword "gentrification," I had to work within Twitter's API restrictions and pricing tiers. At the time of this writing, Twitter's API had several access levels, the most robust of which involve paying a use or subscription fee. By using the free access level, researchers can collect a sample of tweets in real time, or up to seven days in the past. Because of this time constraint, researchers have to begin collecting either as an event has already begun to unfold, or they have to choose a topic or phenomena that they expect will have ongoing interest and activity. Although many of us would like to collect Twitter data that has already occurred, perhaps gathering data after we know a topic or event has been significant, collecting large amounts of historical data isn't possible without paying Twitter's subscription fees and meeting use-case scenarios designed for business and marketing clients. Despite these limitations, tools have been developed to interact with Twitter's API and collect Twitter data continuously in real time, such as George Washington University Libraries' Social Feed Manager (SFM). When I set up SFM in February 2016, it wasn't in response to a specific event or existing hashtag campaign, but with the desire to locate gentrification encounters through Twitter. Once SFM is installed, and Twitter grants the researcher an access token, SFM will continue to collect according to Twitter's API restrictions, which means it can send up to fifteen requests for data every fifteen minutes per access token. Because SFM is ongoing, it allows for collection in real time and over an extended period of time, in my case two years. Although tools like SFM don't allow for historical research, and Twitter's policies and pricing structures largely prevent researchers from collecting Twitter data around an event or time period that has passed, as William I. Wolff (2015) pointed out, social media APIs like Twitter's does allow for in situ study of rhetoric as it emerges from social encounters.
Rhetoric as It Happens: Twitter as Activism Fieldsite
Although in situ commonly refers to something in a fixed, original place and time, Michael Middleton et al. (2015) used in situ to describe a critical and participatory methodology that "provides a means to account for the rhetoric of the everyday, to locate rhetoric in relationship to broader cultural discourses, and to open space for critics to analyze, participate with, and contribute to an emancipatory form of critique" (p. xiv). The authors argued that this participatory approach has deep roots in rhetorical criticism wherein a researcher's particular perspective and relationship to the political and social issues at hand are explicitly involved in the resulting critical product and meaning made. Danielle Endres et al. (2016) observed that rhetoric is currently undergoing a participatory turn, which they emphasize involves relinquishing objectivity and embracing awareness of our influence on our research and knowledge production. From this perspective, research is inventive, rather than scientific. Endres et al. also emphasized that "critical approaches to fieldwork highlight the value of using it to access those everyday rhetorics that would otherwise go unnoticed, undocumented, and unexamined" (p. 517). Although the authors don't directly apply in situ rhetorical fieldwork to social media data collection, Yarimar Bonilla and Jonathan Rossa (2015) "examine the possibilities, the stakes, and the necessity of taking these forms of activism seriously while remaining attentive to the limits and possible pitfalls of engaging in what we describe as 'hashtag ethnography'" (p. 5). Although Twitter data analysis, even when conducted with participatory and critical frameworks, will continue to present logistical and ethical challenges, Twitter data analysis does allow for the study of "rhetoric as it happens" (Endres et al., 2016, p. 516) and opens up new avenues for taking participatory approaches to contemporary social and political phenomena. Extending in situ approaches to large-scale social media data collection and visualization, like the study associated with this webtext, contributes to documenting and examining everyday rhetorics that might not surface in other digital or physical contexts, and perhaps plays a small part amplifying activism and undercutting the "racial shorthand" of dominant media.
Structuring Twitter Data's Arrangement
Many rhetoric and writing studies examinations of social movements on Twitter focus on hashtag collections. At the time when I began collecting, I wasn't aware of any major hashtag campaigns related to gentrification; furthermore, I wanted to locate gentrification encounters that might be dispersed and, although perhaps connected to various hashtags or images, lack association with any single object. By doing so, I wanted to identify social encounters and describe the variety of the materiality and potential consequences of these encounters beyond their association with a particular hashtag or image, what I identify as ad hoc and grassroots activism that largely goes unaccounted for in Twitter studies. To do so, I decided to collect using the keyword "gentrification." The results of this keyword search included any tweets that used "gentrification" as a hashtag, username, or word within the tweet. Using Social Feed Manager (SFM), I collected from February 2016 through the end of February 2018, allowing SFM to run for two full calendar years. This choice was influenced by personal experiences with urban change and reading news pieces, listening to everyday conversations, and observing plot lines in television and film. From my perspective, concerns about gentrification seemed to not only remain a salient topic over wide swaths of public and media spheres but to be increasing in frequency. I also thought that the number of tweets including "gentrification" might be relatively small compared to the massive flurry of activity around a viral hashtag. I also speculated that this keyword would limit my results since character-limited tweets would be encumbered by the lengthy and academic word. By collecting for two years, I hoped to amass a large enough dataset for comparative and individual case studies as well as trend analysis across the whole data collection. Additionally, I chose to collect globally rather than focusing on discrete locations because recent studies in gentrification point to the need for more comparative and rhetorical studies of gentrification resistance, rather than studies that narrowly focus on one neighborhood (Lees et al., 2016). After a year, I had collected over 600,000 tweets, and after two years I had almost tripled that number, resulting in a final dataset of 1,914,243. To begin to understand what this large dataset contained, I first used computational data analytics to glean a thematic overview of the dataset as a whole, partly through frequency analysis.
During the first year of data collection, I converted the JSON files containing the 600,000 tweets and associated metadata I'd collected into a spreadsheet form that mimicked the structure of the data Twitter afforded. Rows were delineated by Tweet IDs and columns corresponded to Twitter characteristics like User Location, Tweet Text, and Coordinates. To get a grasp of important themes, at least those that were most frequently mentioned in tweets, I followed Kris Shaffer's (2017) example in "Mining Twitter Data with R, TidyText, and TAGS," published as an Editor's Choice feature in Digital Humanies Now. Shaffer described how researchers can combine Google Twitter Archiving Data Sheets, or TAGS, with R and an R data structuring library to enable text mining and frequency analysis on Twitter datasets. Shaffer and his co-researcher Bill Fitzgerald use these tools to better understand how misinformation spreads on Twitter. Among other visualizations, R allows for word frequency charts related to bigrams, two-word associations that most frequently occur in a dataset. As Shaffer further pointed out, generating bigrams can be a starting point for other kinds of computational and traditional analyses, generating different possibilities for interpretations and comparison. Because Twitter data is rich in metadata, each tweet is multidimensional, containing not just the tweet text but often embedded images, location information, and links to other users and media. In the study, Shaffer ultimately focused on the way in which URLs are shared and disseminated across social networks of users to better understand how misinformation spreads on Twitter. I began with a similar approach to the dataset I collected, focusing on producing word frequencies and bigrams, and rather than following the path made by sharing a piece of misinformation, I tried to find a way to locate encounters converging around "gentrification" and the rhetoric that emerges from those encounters.


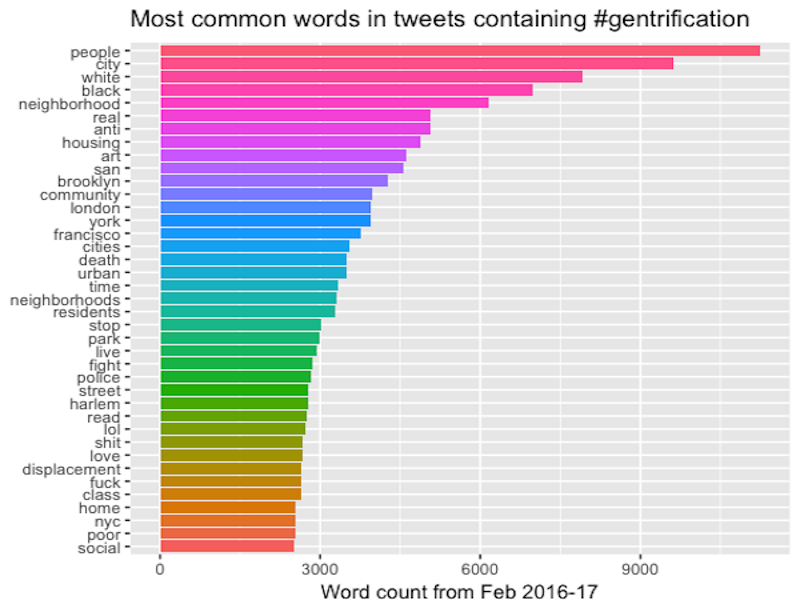
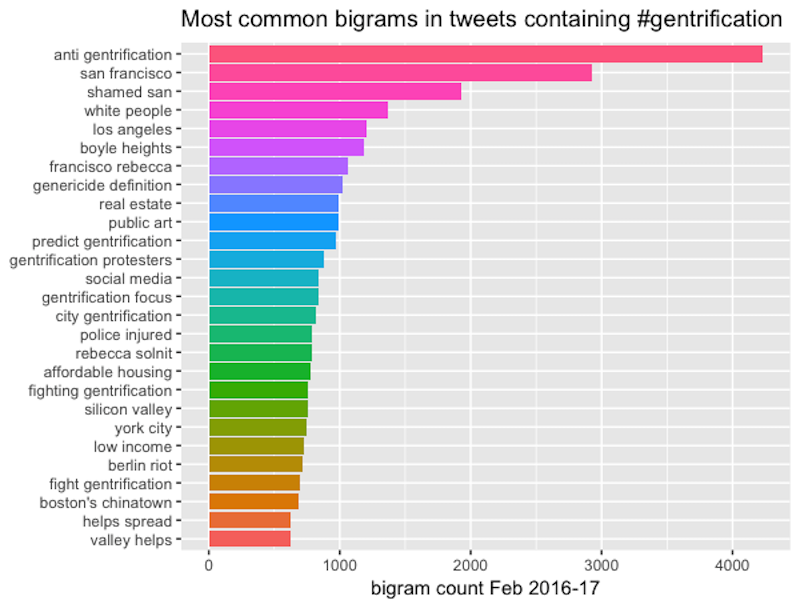
In Figure 1, single-word frequencies begin to illuminate the "gentrification" Twitter data's prevalent relationship to race and specific locations. Bigrams provide slightly more contextualized renderings of these themes. For instance, instead of "people," the bigram is "white people"; "anti" becomes "anti-gentrification," and "art" is "public art." Analyzing these preliminary data analysis results began to direct my attention and research to encounters involving certain locations and agents involved in gentrification as identified most frequently by users in the data collection. Looking at word pairs, locations become clearer, for instance: Los Angeles, Boyle Heights, Boston's Chinatown. This machine-reading and text-mining analysis applied to the first-year data collection led me to focus subsequent research and visualizations around particular themes and locations influenced by the most prevalent words. This kind of macroanalysis (Graham et al., 2015; Jockers, 2013; Ramsay, 2011) can complement traditional methods of close reading and research; however, as Mathew Jockers (2013) noted:
It is also problematic to draw conclusions about specific texts based on some general sense of the whole. This, however, is not the aim of macroanalysis. Rather, the macroscale perspective should inform our close readings of the individual texts by providing, if nothing else, a fuller sense of the literary-historical milieu in which a given book exists. It is through the application of both approaches that we reach a new and better-informed understanding of the primary materials. (p. 28)
Although Jockers's discipline is literature, rhetoric and writing studies can adopt the idea of vacillating perspectives to explore larger data collection's environment—in my case the two-year, approximately two million tweets and metadata related to "gentrification"—and then balance this macroscale perspective with closer examination of data subset(s). Vacillating between macro and micro scale, computer and human reading, provides comparative possibilities between data scales and methodological opportunities for rhetoric and writing studies; however, text mining and frequency analysis certainly don't resist the omniscient, distant view that data and visualization critiques find problematic. As a way to complement and trouble distant, frequency-based reading, comparative data studies can provide microanalyses, attending to smaller data subsets and infrequent data. After all, it is the idiosyncratic or infrequent that goes missing in the frequency and trend analysis that more heavily weight and point our perspective to the data that is most similar and most frequent. Departing from frequency analysis and other kinds of text-mining quantifications by creating smaller data subsets can also work towards visualizing data in "situated contexts and geographic locations" (D'Ignazio, 2017). By doing so, we might better attend to data's nuance and create multiple visualizations that value qualitative, polyvocal accounts of social and political phenomena like gentrification encounters. Furthermore, such a comparative approach brings critical attention to how different scales contribute to knowledge making and how rhetorical feminist data methodologies might begin to talk back to positivist data paradigms.
