Data Visualization
25.1 Fall 2020
Logging On
Introduction to the Special Issue: Data Visualization in Composition Studies
John R. Gallagher & Dànielle Nicole DeVoss, Special Issue Editors
Logging On: Inclusivity Action Items
New Staff & Journal UpdatesCheryl Ball, Editor
-
Disputatio
-
Dataweaving: Textiles as Data Materialization
Krystin Gollihue & Mai Nou Xiong-Gum
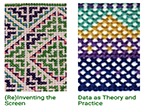
"In this manifesto, we argue that textiles are another form of data visualization. Textiles serve as a medium for storing, connecting, and coding data, but the practice of encoding information onto textiles through “craft” is a practice that comes steeped in histories of technology, privilege, and erasure."
-
-
Topoi
-
Arranging a Rhetorical Feminist Methodology: The Visualization of Anti-Gentrification Rhetoric on Twitter
Desiree Dighton
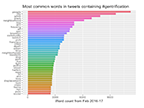
"In this webtext, I develop an in situ approach for the rhetorical study of large-scale social media data. Grounding this in situ methodology in rhetoric and feminist critiques of data and visualization, this webtext models techniques and strategies for collecting, analyzing, and visualizing Twitter data."
-
Sight, Sound, and Practice: An Exploration of the Ways Visualizations Can Support Learning to Compose
Ben Lauren & Bill Hart-Davidson
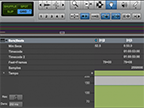
"Our invitation is to think about composing as inclusive of written texts, multimodal webtexts, and all the things writing and rhetoric folks would normally be asked to help students improve in creating. But for this experience, we don't want to stop there. We want you to also think about composing other things. Think about films. Think about dance choreography. Think about baking pies. Think about music. How do humans learn to compose these things? How can a visualization aid in learning these things?"
-
Visualizing Translation
Heather Noel Turner & Laura Gonzales
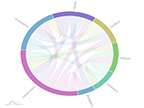
"In a special issue about data visualization in writing studies, we use this webtext to both make connections between translation and data visualization and to argue that as our fields continue developing methodologies for and orientations to linking writing with visualization, we should take time to honor the communities and spaces for whom visual and alphabetic communication have always been inherently connected."
-
-
Inventio
-
Brightness Behind the Eyes: Rendering Firefighters’ Literacies Visible
Timothy R. Amidon
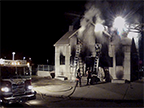
"This webtext outlines how decisions about data collection, segmenting, organizing, coding, structuring, styling, and modeling data influenced, in turn, which elements of literate practice were emphasized within the visualizations."
-
-
Praxis
-
Networked (Writing) Centers: Utilizing Online Visualization Tools on Large Multi-Institutional Data Sets
Joseph Cheatle, Genie Giaimo, Candace Hastings, & Christine Modey
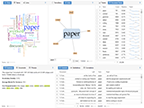
"We focus on a corpus of around 2 million words and four types of data visualization to make arguments about the larger field of writing center studies. We also address the value of cross-institutional work for writing center studies, particularly related to documents (e.g., sessions notes) that are often under-utilized at individual institutions."
-
Teaching Dear Data
Madeleine Sorapure & Austin Fauni
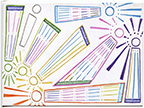
"How can we—as citizens and consumers, as teachers and students—develop the ability to understand, explore, and analyze data of various kinds in order to inform our decisions on matters that are important to us? The Dear Data project described in this webtext suggests that asking students to produce and visualize small personal data can open a process of engaging with data analytically and creatively."
-
-
PraxisWiki
-
Storytelling With and Around Data
Patrick Andrew Danner
-
Following the Narrative: Using Data Visualization in the Composition Classroom
Shannon Fanning
-
Rhetmap.org: Composing Data for Future Re-Use and Visualization
Chris Lindgren & Jim Ridolfo
-

